
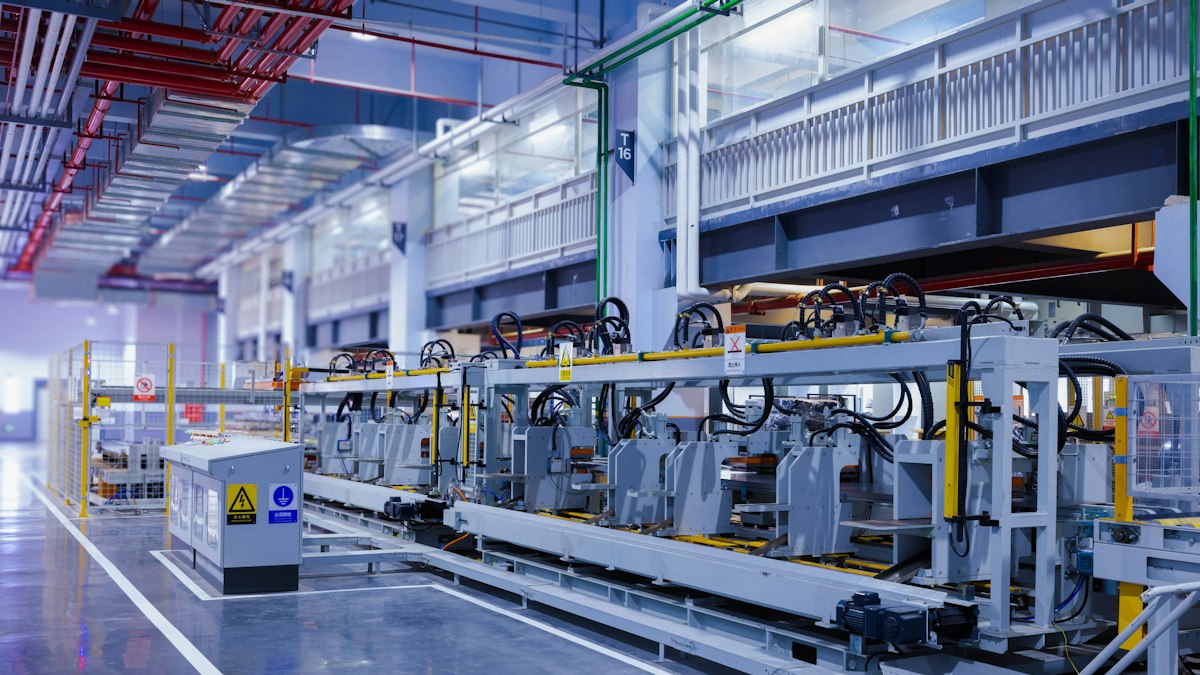
Overall Equipment Effectiveness shows how much of your planned production time is truly productive. Here is the formula, a worked example and how to use the three factors to find improvements.
Overall Equipment Effectiveness (OEE) measures how well a machine or production line uses the time it is planned to run. It combines three factors, availability, performance and quality, into a single percentage. A perfect score of 100% means producing only good parts, as fast as possible, with no stops.
The formula
OEE = Availability × Performance × Quality
- Availability = Run time ÷ Planned production time
- Performance = (Ideal cycle time × Total count) ÷ Run time
- Quality = Good count ÷ Total count
Worked example
A machine is scheduled for an 8-hour shift of 480 minutes. (Planned breaks are excluded from planned production time.)
- Unplanned stops and changeovers total 60 minutes, so run time is 480 − 60 = 420 minutes.
- The ideal cycle time is 1.0 minute per part.
- The machine produces 380 parts in total.
- 361 are good; 19 are scrap or rework.
| Factor | Calculation | Result |
|---|---|---|
| Availability | 420 ÷ 480 | 87.5% |
| Performance | (1.0 × 380) ÷ 420 | 90.5% |
| Quality | 361 ÷ 380 | 95.0% |
| OEE | 0.875 × 0.905 × 0.950 | 75.2% |
A useful cross-check: OEE also equals (good count × ideal cycle time) ÷ planned production time = (361 × 1.0) ÷ 480 = 75.2%.
The six big losses
OEE is most useful when you break losses down into categories you can act on:
| Factor | Losses |
|---|---|
| Availability | 1. Equipment breakdowns. 2. Setups and changeovers. |
| Performance | 3. Minor stops and idling. 4. Reduced speed. |
| Quality | 5. Start-up rejects. 6. Production rejects and rework. |
What is a good OEE?
An OEE of 85% is frequently cited as a "world-class" benchmark for discrete manufacturing, while many plants operate considerably lower when they first measure honestly. Benchmarks vary by industry and process. More important than comparing with other plants is tracking your own trend and understanding your biggest losses.
Collecting reliable data
- Define terms clearly: what counts as planned time, what the ideal cycle time is, what counts as a stop.
- Use the true ideal cycle time based on design capability, not a slower "standard" that hides losses.
- Record stop reasons, even with simple paper logs at first.
- Automate data capture from machine signals where possible to reduce manual errors.
Using OEE to improve
- Identify the factor with the biggest loss.
- Use a Pareto chart of stop reasons or defect types to find the largest contributors.
- Investigate root causes; the 5 Whys method in our submissions library is a simple starting point.
- Implement fixes, such as quicker changeovers, better maintenance or 5S organisation.
- Track the effect on OEE over the following weeks.
Cautions
OEE is a diagnostic tool, not a target to game. Avoid comparing OEE between very different machines, and never improve the number by redefining planned time or cycle times. Use it to find and remove losses honestly.







0 Comments
No comments yet — be the first to share what you think.