
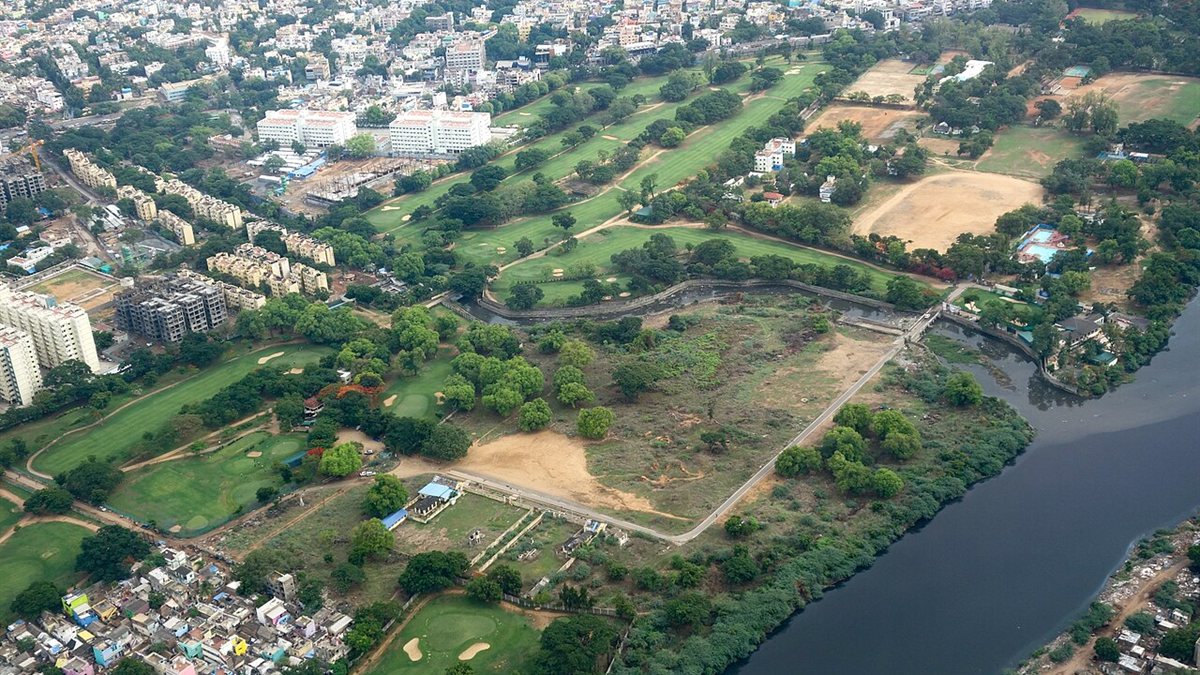
Every GPS app distance, yardage book and flyover video starts with a map of the course. Here is how golf courses are surveyed and mapped, what accuracy is needed, and why maps must be kept current.
When a golf app tells you it is 152 metres to the middle of the green, or a yardage book shows a bunker carry of 210 yards, that information comes from a digital map of the course. The quality of that map determines whether the numbers can be trusted. Here is how courses are mapped and how the data is used.
Step 1: Capture the course
Aerial and satellite imagery
High-resolution imagery shows the outline of fairways, greens, bunkers, water and trees. It is the basis of most course maps, but imagery must be accurately georeferenced, and features hidden by trees or shadows can be hard to trace.
Drone photogrammetry
Drones capture overlapping photographs that software combines into detailed orthomosaic maps and 3D surface models. Drone surveys can deliver very high resolution, and with surveyed ground control points, good positional accuracy. Our guide to ground sample distance explains how flight height affects detail.
LiDAR
Airborne or drone LiDAR measures the ground with laser pulses, producing precise elevation data, even under some tree cover. It is especially valuable for capturing green contours, slopes and drainage. See LiDAR vs photogrammetry for the trade-offs.
Ground GPS survey
Surveyors with high-precision GNSS equipment record key points on the ground: tee markers, sprinkler heads, green edges and features that appear in yardage books. Ground survey is also used to check aerial data.
Step 2: Build the map
The captured data is processed into GIS layers, each representing a feature type: tees, fairways, rough, bunkers, water, greens, paths, trees and boundaries. Each feature is a shape with an accurate position, which makes distance calculations possible. Elevation data adds slopes and contours.
Step 3: Produce the outputs
- GPS app and device data: green centre, front and back points, hazard positions.
- Yardage books: hole drawings with measured distances from reference points and green slope detail. See how to read a yardage book.
- Hole graphics and tee signs: stylised illustrations for signage, scorecards and websites.
- 3D models and flyovers: visualisations used for marketing and for helping visiting golfers preview holes.
- Course management maps: irrigation, mowing areas, drainage and maintenance planning for greenkeeping teams.
How accurate does it need to be?
Different uses need different accuracy. Marketing illustrations can be stylised. Yardage books and GPS distances need positional accuracy that keeps errors small relative to the distances golfers care about. Green contour mapping for renovation planning needs precise elevation data. Agree the required accuracy with any supplier before work starts, and ask how it will be verified.
Keeping maps current
Courses change: greens are rebuilt, bunkers are added or removed, tees are extended, trees grow or are felled. Every change makes yardage books, app data and signage gradually less accurate. Clubs should:
- Survey existing features before a renovation, so the original can be compared or restored.
- Re-survey changed areas afterwards and update all products that depend on them.
- Keep the base survey data, so updates do not mean starting from scratch.
Questions for clubs commissioning mapping
- What capture method and accuracy will be used?
- Will we own the base data and receive it in standard GIS formats?
- Which products can be generated from one survey?
- How will updates be handled after course changes?










0 Comments
No comments yet — be the first to share what you think.