
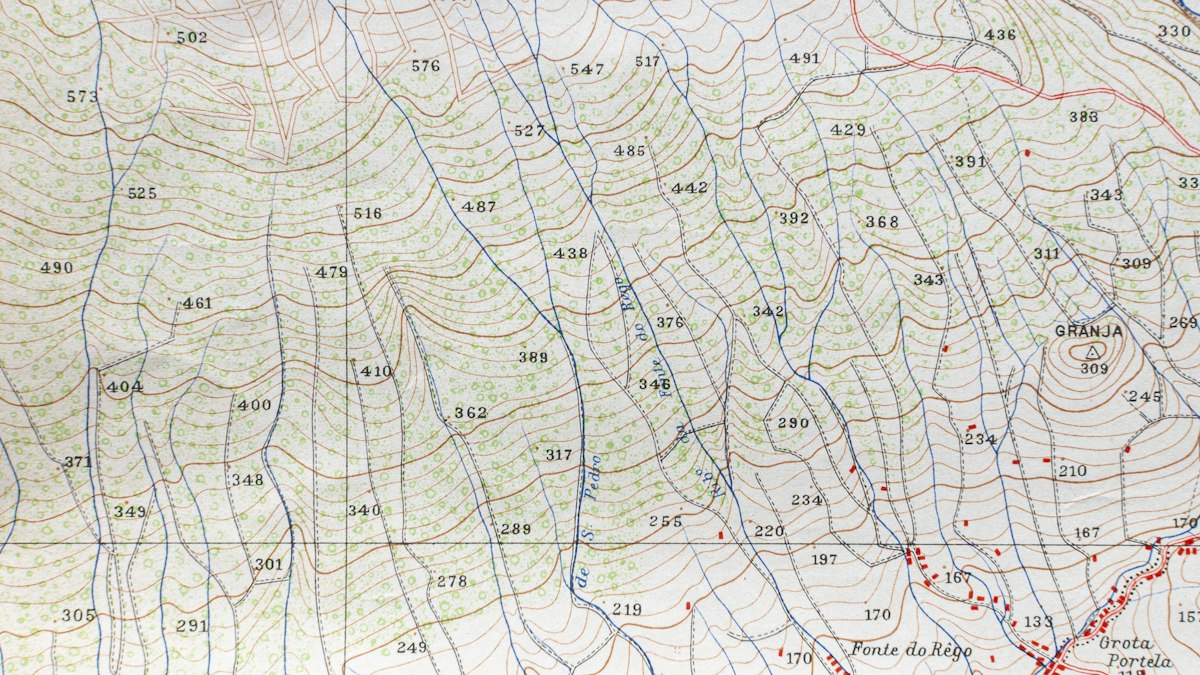
Elevation models come in different types, and the labels are used inconsistently. Here is the difference between a digital surface model and a digital terrain model, and which one your project needs.
Elevation models describe the height of the land and everything on it in digital form. They underpin flood modelling, construction planning, solar studies, telecoms line-of-sight analysis and much more. Three acronyms appear constantly: DEM, DSM and DTM. Using the wrong one leads to the wrong answer.
Digital Surface Model (DSM)
A DSM represents the elevation of the top surface: the ground where it is exposed, plus buildings, trees, vehicles and anything else on it. Imagine draping a sheet over the landscape from above.
Use it for: line-of-sight and radio planning, solar exposure, urban 3D visualisation, tree canopy height (combined with a DTM), and obstruction analysis near airports.
Digital Terrain Model (DTM)
A DTM represents the bare earth, with buildings and vegetation removed. It shows the shape of the ground itself.
Use it for: flood and drainage modelling, contours, earthworks and cut-and-fill calculations, road and pipeline design, geological and archaeological analysis.
Some practitioners use "DTM" more specifically for a bare-earth model that also includes break lines and other features describing the terrain, as opposed to a simple grid of heights.
Digital Elevation Model (DEM)
"DEM" is often used as a general term for any elevation model. In many datasets, especially national elevation products, DEM means bare-earth elevation, effectively a DTM. Because usage varies, always read the metadata to check what a dataset called "DEM" actually represents.
Normalised DSM (nDSM)
Subtracting the DTM from the DSM gives a normalised DSM: the height of objects above the ground. It is commonly used to estimate building heights and tree canopy heights.
How they are produced
- Photogrammetry naturally produces a DSM, because cameras see the top surface. Creating a DTM requires filtering out objects, which is difficult under dense vegetation.
- LiDAR produces point clouds with multiple returns. After ground classification, ground points create the DTM and first returns create the DSM. See LiDAR vs photogrammetry.
- Satellite missions provide global elevation datasets at coarser resolution, useful for regional analysis.
Raster or TIN?
- Raster grids store one elevation value per cell. They are simple to analyse and widely supported.
- TINs (triangulated irregular networks) connect points into triangles, preserving sharp features such as embankment edges more faithfully. They are common in engineering design.
Resolution and accuracy are different
Resolution is the cell size, for example 0.5 metres. Accuracy is how close the values are to reality. A fine-resolution model built from poor data can still be inaccurate. Check both, and look for an accuracy statement based on independent checkpoints.
Check the vertical datum
Heights must be measured relative to something: a geoid-based height system, an ellipsoid or a local datum. Mixing datasets with different vertical datums can introduce errors of many metres. Our guide to coordinate reference systems covers horizontal and vertical references.
Quick guide
| Task | Model |
|---|---|
| Flood risk, drainage | DTM |
| Earthworks volumes | DTM (or surface of stockpiles) |
| Signal line of sight | DSM |
| Building and tree heights | nDSM (DSM minus DTM) |
| Solar potential on roofs | DSM |






0 Comments
No comments yet — be the first to share what you think.