
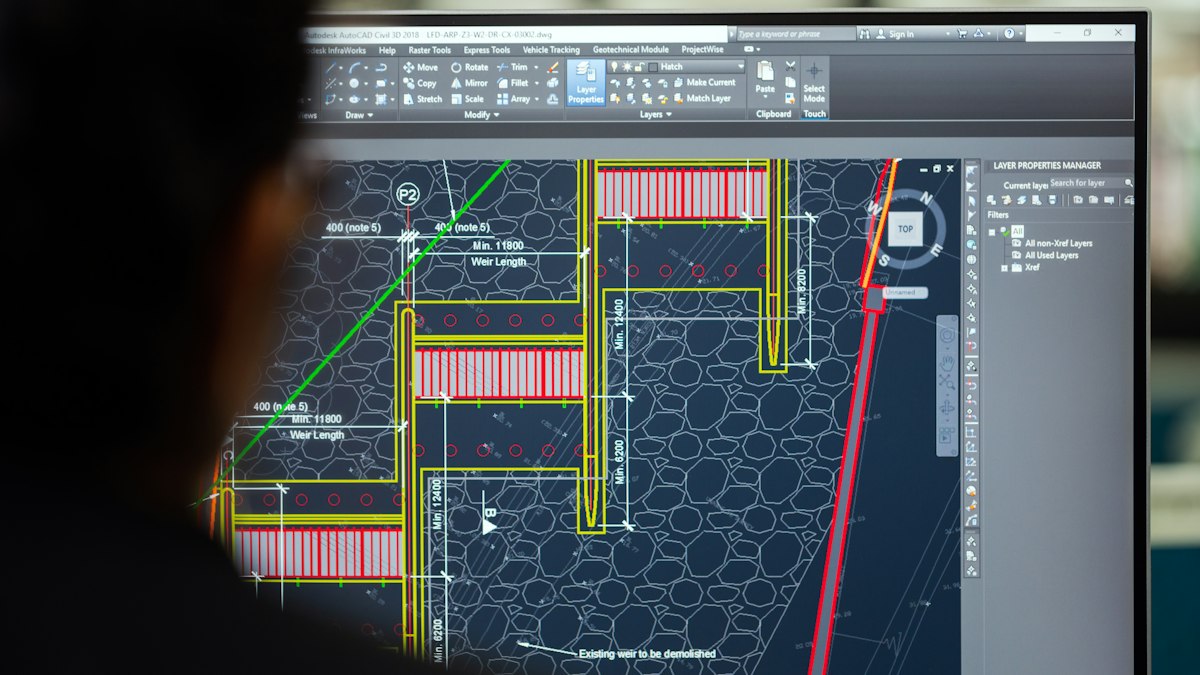
QGIS is a free, open-source GIS used by professionals worldwide. This beginner's walkthrough covers installation, loading data, styling layers, basic analysis and exporting a finished map.
QGIS is a free and open-source geographic information system used by governments, researchers, consultancies and hobbyists. It can view, edit, analyse and publish spatial data, and it runs on Windows, macOS and Linux. This walkthrough takes you from installation to a finished map.
Step 1: Install QGIS
Download QGIS from the official website. Two versions are usually offered: the latest release with the newest features, and the long-term release (LTR), which is more stable. Beginners and organisations generally do well with the LTR.
Step 2: Understand the interface
- Map canvas: the large central area showing your data.
- Layers panel: lists every layer; the order controls what is drawn on top.
- Browser panel: lets you find and drag in data from folders and online services.
- Toolbars: navigation, selection, editing and measurement tools.
- Processing Toolbox: hundreds of analysis tools, opened from the Processing menu.
Step 3: Get some data
Good free sources for practice include:
- Natural Earth: public domain country boundaries, cities, rivers and roads at several scales.
- OpenStreetMap: detailed streets, buildings and points of interest, under an open licence that requires attribution.
- Your national mapping agency or open data portal.
Step 4: Load layers
Drag a file into the map canvas, or use Layer > Add Layer. Common formats include GeoPackage, Shapefile, GeoJSON and CSV with coordinates for vectors, and GeoTIFF for rasters such as elevation models or imagery.
Check each layer's coordinate reference system in its properties. QGIS can display layers in different systems together by reprojecting on the fly, but for measurements and analysis you should choose an appropriate project CRS. See coordinate reference systems for beginners.
Step 5: Add a basemap
A basemap gives context. In the Browser panel, the XYZ Tiles entry includes OpenStreetMap by default; double-click it to add. Respect the tile provider's usage policy and include attribution on published maps.
Step 6: Style your layers
Open a layer's properties and choose Symbology:
- Single symbol: the same style for every feature.
- Categorized: different colours for categories, such as land-use types.
- Graduated: colour ramps for numeric values, such as population.
Add labels from a field such as names. Keep colours meaningful and readable, and limit the number of categories.
Step 7: Try a simple analysis
- Buffer: create zones a fixed distance around features, such as 500 metres around schools.
- Clip: cut one layer to the boundary of another.
- Count points in polygon: how many facilities fall in each district.
- Hillshade: visualise terrain from an elevation raster; see DEM vs DSM vs DTM.
Run these from the Processing Toolbox. Use a projected CRS in metres for distance-based tools.
Step 8: Make a print layout
Use Project > New Print Layout to design a finished map. Add the map, a title, legend, scale bar, north arrow and source credits, then export to PDF or image. Saving the layout means you can update the data later and re-export instantly.
Keep learning
The QGIS project provides a free user manual and training material on its website, and the user community is active and helpful. Once comfortable, explore plugins, the graphical modeller for repeatable workflows, and Python scripting for automation.








0 Comments
No comments yet — be the first to share what you think.